
Modern organizations collect data from applications, customer interactions, connected devices, transactions, operational systems, and external platforms. Yet having more data does not automatically lead to better decisions. Teams often struggle with disconnected systems, inconsistent definitions, slow reporting, complex data pipelines, and difficulty putting machine learning models into production. Databricks provides a data and AI platform that organizations can use to build data pipelines, manage large-scale analytics workloads, collaborate on data science, and develop machine learning and AI solutions. Its lakehouse approach brings data engineering, analytics, and AI workflows together on a shared foundation. The value of Databricks depends on how well it is matched to a business problem. A healthcare provider may need governed access to clinical and operational data. A retailer may want more reliable demand forecasts. A manufacturer may need to analyze equipment signals before failures disrupt production. Each scenario requires the right data architecture, governance, operating model, and measures of success. In this guide, we explore practical Databricks use cases across seven industries, explain the building blocks of a modern lakehouse, and outline a realistic approach to implementation.
What Is Databricks?
Databricks is a data intelligence platform built around technologies and services for data engineering, analytics, data science, machine learning, and AI. Organizations use it to ingest and transform data, support analytical workloads, collaborate across technical teams, and operationalize data products. A common architectural pattern is the lakehouse: an approach that combines the flexibility and scale associated with data lakes with capabilities needed for reliable data management and analytics. In a typical implementation, raw data is ingested from source systems, validated and transformed through successive processing layers, and made available to dashboards, applications, data science workflows, and AI systems. Databricks is not a substitute for every system in an enterprise. Source applications, integration tools, identity providers, BI platforms, and business processes may remain in place. The platform’s role is to provide a governed and scalable foundation for the workloads it is best suited to support.
Core Building Blocks of a Databricks Lakehouse
A modern data platform built on Databricks combines data engineering, reliable storage, governance, analytics, and business intelligence to transform raw data into actionable insights. The following components form the foundation of an efficient, scalable, and secure data architecture.
1. Data Ingestion and Engineering
Data can originate from various sources, including relational databases, business applications, files, event streams, APIs, and cloud storage platforms. An effective data ingestion strategy ensures that information flows reliably from these sources into the data platform.
Organizations should select ingestion patterns based on latency requirements, data volumes, source-system limitations, reliability, and recovery needs. Batch processing may be sufficient for daily reporting and periodic analysis, while streaming or incremental processing can be more suitable when business decisions depend on near-real-time information.
A well-designed data engineering pipeline helps automate data movement, improve processing efficiency, and maintain consistent data availability across the organization.
2. Delta Lake and Reliable Data Tables
Delta Lake is an open-source storage framework commonly used with Databricks to enhance the reliability and management of data stored in a data lake. It provides transactional capabilities and supports dependable data operations, making it easier for organizations to manage analytical workloads at scale.
To achieve optimal performance and reliability, teams should carefully configure table formats, data retention policies, partitioning or clustering strategies, and routine maintenance processes. These decisions should align with the organization’s data volumes, query patterns, and performance requirements.
By implementing appropriate storage and table-management practices, businesses can improve data consistency, simplify maintenance, and establish a reliable foundation for downstream analytics.
3. Medallion Architecture
The Medallion Architecture is a widely used data design pattern in Databricks environments. It organizes data into three logical layers: Bronze, Silver, and Gold. Each layer progressively improves data quality and prepares information for different business requirements.
Bronze Layer: Stores ingested raw data with minimal transformation, preserving the original information for traceability, reprocessing, and auditing.
Silver Layer: Refines the raw data through validation, standardization, deduplication, and the application of relevant business rules.
Gold Layer: Contains curated, business-ready datasets optimized for specific analytical, reporting, and operational use cases.
This layered approach helps establish a structured data processing workflow, making it easier to maintain data quality and support multiple business requirements.
However, the Medallion Architecture is a design pattern rather than a mandatory implementation. Organizations should adapt the number of layers, transformation processes, and data flows to their specific business needs and technical environment.
4. Governance, Access, and Data Lineage
Data governance is a critical part of any modern data platform and should be incorporated into the architecture from the beginning rather than added after implementation.
Unity Catalog in Databricks supports centralized governance of data and AI assets, including permissions, asset discovery, and lineage for supported assets. These capabilities help organizations manage access consistently and understand how data moves through their analytical workflows.
An effective governance strategy should also define data ownership, classification standards, retention policies, access reviews, audit requirements, and safeguards for sensitive information.
By establishing clear governance practices, organizations can improve data security, support compliance obligations, increase transparency, and build greater confidence in the information used for business decisions.
5. Analytics, Machine Learning, and AI
Once data has been processed and curated, it can support a wide range of analytical and intelligent applications. Databricks enables organizations to work with data for SQL analytics, business intelligence, forecasting, anomaly detection, machine learning, and selected generative AI use cases.
However, successful implementation requires more than selecting the right technology. Organizations must ensure that the underlying data is accurate, models are evaluated against appropriate criteria, access controls are enforced, and workloads are monitored throughout their lifecycle.
Moving from experimentation to production also requires a clear deployment strategy, performance monitoring, model evaluation, and ongoing maintenance.
When these elements are managed effectively, businesses can move beyond historical reporting and use their data to identify patterns, anticipate trends, automate selected processes, and support better-informed decisions.
6. Data Consumption Through BI and Applications
The final component of a Databricks data platform is making trusted data accessible to the people and systems that need it.
Business users can consume governed datasets through business intelligence platforms such as Microsoft Power BI and other reporting tools. These integrations enable organizations to develop interactive dashboards, monitor key performance indicators, and explore business performance using consistent data.
At the same time, applications and operational services can access data through supported interfaces, depending on the platform architecture and workload requirements.
Organizations should select the appropriate consumption layer based on user needs, security requirements, performance expectations, integration complexity, and existing enterprise standards.
A well-designed consumption strategy ensures that the value created through data engineering and analytics translates into practical business outcomes.
Core Capabilities That Drive Real Impact
Lakehouse Architecture
Databricks simplifies data complexity by unifying structured and unstructured data in one platform. This enables faster analytics, better performance, and consistent governance across the organization.
Enterprise-Grade Scalability
Designed for high-performance workloads, Databricks supports large-scale data processing while maintaining strict compliance and security standards.
Unified Data Engineering and Data Science
Teams can collaborate in real time using tools that support Python, SQL, Scala, and R. This accelerates everything from data preparation to advanced analytics.
MLOps and AI Acceleration
With integrated MLflow and automation capabilities, Databricks enables organizations to build, deploy, and monitor machine learning models efficiently and reliably.
At niracore, we leverage these capabilities to design data ecosystems that are not only powerful but also future-read
Databricks Across Industries: Real-World Applications
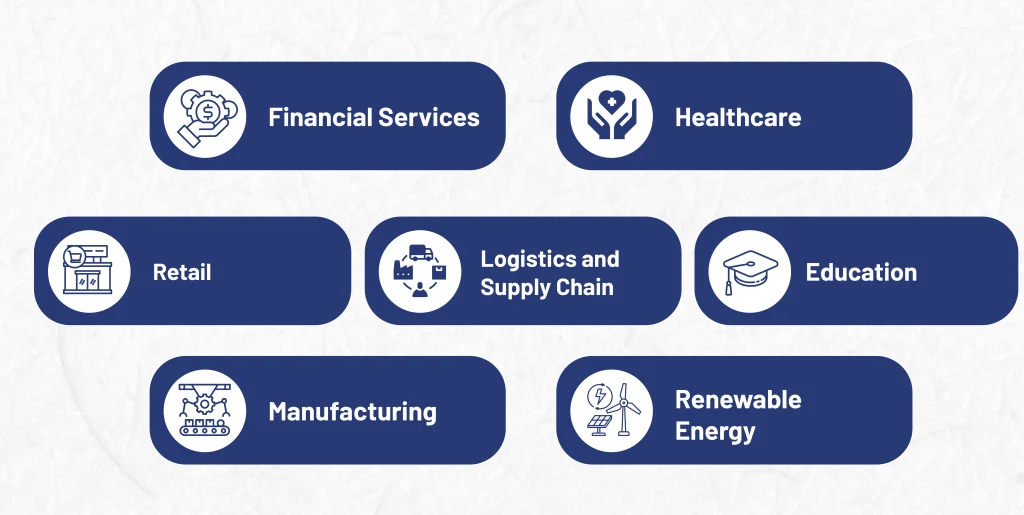
Banking & Financial Services
Banks, insurers, and financial service providers generate data from transactions, customer accounts, digital channels, claims, market feeds, and risk systems. A governed analytics platform can help teams analyze these datasets consistently while maintaining traceability and appropriate controls.
Fraud and Anomaly Analysis
Combine transaction and contextual signals to flag activity for investigation. Detection rules and models must be validated against false positives and operational requirements.
Credit Risk Analytics
Prepare features and historical datasets for risk analysis, portfolio monitoring, and model development.
Regulatory and Management Reporting
Standardize source data and business definitions to improve the traceability of reporting outputs.
Customer Analytics
Understand product usage and customer journeys using appropriately authorized data.
Insurance Analytics
Analyze claims patterns, processing times, and potential anomalies to support investigation and operational planning.
Example Workflow
Transaction, account, and reference data are ingested through controlled pipelines.
Data quality checks reconcile records and validate key fields.
Curated datasets are made available to approved risk analysts and model developers.
Model outputs are evaluated, versioned, monitored, and integrated into human review or approved decision workflows where appropriate.
KPI to Consider
Relevant measures may include:
- Alert precision
- Investigation turnaround time
- Data reconciliation exceptions
- Reporting cycle time
- Model drift
- The percentage of records meeting agreed quality rules
Implementation Considerations
Financial institutions need strong controls for access, auditability, model governance, retention, and change management. A platform should fit the institution’s risk framework and regulatory obligations rather than introduce an isolated analytics environment.
Healthcare
Healthcare organizations work with clinical records, claims, laboratory results, medical devices, scheduling systems, and operational data. These sources can be difficult to combine because they may use different formats, identifiers, and definitions. Databricks can help build governed pipelines that standardize data and make approved datasets available for analysis.
Common Use Cases :
Operational Reporting
Combine scheduling, admissions, staffing, and service data to monitor capacity, wait times, and resource utilization.
Claims and Revenue-Cycle Analytics
Identify processing delays, denial patterns, and differences in reimbursement workflows.
Research Data Preparation
Prepare quality-controlled datasets for approved research and analytical studies.
Population Health Analysis
Analyze appropriately governed datasets to understand patterns across patient populations.
Predictive Maintenance
Where device telemetry is available, analyze equipment signals to support maintenance planning.
Example Workflow :
Data from approved clinical and administrative sources is ingested into a controlled landing area.
Validation rules check required fields, identifiers, duplicates, and allowed values.
Standardized datasets are then curated for specific reporting or research purposes.
Role-based access and audit processes restrict access to sensitive information, while dashboards present agreed operational measures.
KPIs to Consider :
Possible measures include:
Reporting latency
Data completeness
Duplicate-record rates
Claims processing time
Denial rate
Time required to prepare approved research datasets
Define baselines and measurement methods before making claims about improvement.
Implementation Considerations :
Healthcare data can be highly sensitive. Confirm applicable privacy laws, contractual obligations, data residency, access controls, de-identification needs, and institutional approvals before
Retail and E-commerce
Retailers must connect point-of-sale transactions, e-commerce activity, product catalogs, inventory, promotions, supplier data, and customer interactions. When these datasets remain disconnected, teams can struggle to understand product performance, plan inventory, or measure promotions consistently.
Common Use Cases
- Demand forecasting: Combine historical sales, promotions, seasonality, pricing, and other relevant signals to support forecasts.
- Inventory optimization: Compare stock positions, sales velocity, lead times, and replenishment rules to identify potential shortages or excess inventory.
- Customer 360 analytics: Build governed customer views for authorized segmentation and journey analysis.
- Promotion measurement: Evaluate promotional performance against suitable baselines and account for seasonality or other confounding factors.
- Product recommendations: Prepare interaction and catalog data for recommendation models, with suitable privacy and evaluation controls.
Example Workflow
Sales and inventory data from stores and online channels is ingested on a defined schedule. Product identifiers, store codes, and calendar fields are standardized. Curated tables combine sales, stock, pricing, and promotion data. Forecasts and analytical outputs can then be exposed to planning dashboards or replenishment workflows.
KPIs to Consider
Potential metrics include forecast error, stockout rate, inventory turnover, sell-through rate, promotion return, and time required to refresh category reports. Select metrics that match the retailer’s operating model and data maturity.
Implementation Considerations
Product and location master data, late-arriving transactions, seasonal patterns, and inconsistent promotion definitions can undermine results. Validate the quality of these inputs before relying on advanced models.
Logistics and Supply Chain
Supply chains span suppliers, warehouses, transport partners, order systems, and customer delivery channels. Data delays and inconsistent status codes can make it difficult to understand where orders are, why service levels are missed, and how disruptions affect downstream operations.
Common Use Cases
Shipment Visibility
Combine shipment events and order information to provide a more consistent view of delivery progress.
Delivery Performance Analytics
Measure on-time delivery, transit time, failed delivery attempts, and exception reasons.
Demand and Supply Planning
Bring together order history, supplier lead times, inventory, and forecast information.
Route and Capacity Analysis
Prepare operational datasets to evaluate route performance, utilization, and cost drivers.
Predictive Estimated Arrival Times
Use suitable historical and live signals to estimate arrival times, with ongoing model monitoring.
Example Workflow
Order, warehouse, transport, and carrier events are collected through batch or event-based pipelines. Common shipment identifiers and status definitions are established.
The platform calculates milestone timestamps, dwell time, delivery exceptions, and service-level measures. Approved outputs can feed dashboards, planning tools, or operational alerts.
KPIs to Consider
Track the following key performance indicators:
- On-time-in-full delivery
- Average transit time
- Dwell time
- Failed delivery rate
- Inventory days
- Order-to-delivery cycle time
- The share of events received within the expected window
Implementation Considerations
Partner data may be incomplete or delayed, and different carriers may define milestones differently. Establish data contracts and exception handling before using the data for automated decisions.
Manufacturing
Supply chains span suppliers, warehouses, transport partners, order systems, and customer delivery channels. Data delays and inconsistent status codes can make it difficult to understand where orders are, why service levels are missed, and how disruptions affect downstream operations.
Common Use Cases
Shipment Visibility
Combine shipment events and order information to provide a more consistent view of delivery progress.
Delivery Performance Analytics
Measure on-time delivery, transit time, failed delivery attempts, and exception reasons.
Demand and Supply Planning
Bring together order history, supplier lead times, inventory, and forecast information.
Route and Capacity Analysis
Prepare operational datasets to evaluate route performance, utilization, and cost drivers.
Predictive Estimated Arrival Times
Use suitable historical and live signals to estimate arrival times, with ongoing model monitoring.
Example Workflow
Order, warehouse, transport, and carrier events are collected through batch or event-based pipelines. Common shipment identifiers and status definitions are established.
The platform calculates milestone timestamps, dwell time, delivery exceptions, and service-level measures. Approved outputs can feed dashboards, planning tools, or operational alerts.
KPIs to Consider
Track the following key performance indicators:
- On-time-in-full delivery
- Average transit time
- Dwell time
- Failed delivery rate
- Inventory days
- Order-to-delivery cycle time
- The share of events received within the expected window
Implementation Considerations
Partner data may be incomplete or delayed, and different carriers may define milestones differently. Establish data contracts and exception handling before using the data for automated decisions.
Education
Educational institutions and research organizations may hold data across student information systems, learning platforms, admissions, finance, research environments, and facilities. A consistent data foundation can improve reporting and support approved analytical projects.
Common Use Cases
Student Success Analysis
Examine engagement, attendance, course progression, and other authorized indicators to help staff identify where support may be needed.
Enrollment Forecasting
Analyze historical applications, acceptance, registration, and program demand.
Institutional Reporting
Standardize definitions for enrollment, retention, completion, and resource utilization.
Research Data Engineering
Prepare and document datasets for approved research workflows.
Resource Planning
Combine timetable, facility, and utilization data to support capacity planning.
Example Workflow
Data from approved institutional systems is ingested and mapped to consistent academic terms, program identifiers, and reporting definitions.
Quality checks highlight missing or conflicting records.
Curated datasets support dashboards and authorized analytical studies, with access controls appropriate to student and research information.
KPIs to Consider
Possible measures include:
- Enrollment forecast error
- Time to prepare institutional reports
- Data completeness
- Course completion rates
- Retention rates
- Facility utilization
Use context when interpreting student-level measures; correlations do not establish causes.
Implementation Considerations
Student and research information may have strict confidentiality requirements. Define lawful access, consent or other applicable authorization, retention, and disclosure rules before using data for analysis.
Databricks vs. Microsoft Fabric vs. Snowflake
Databricks, Microsoft Fabric, and Snowflake address overlapping but not identical data platform needs. The right choice depends on workloads, existing technology, team skills, governance, integration requirements, performance, and total cost. A fair evaluation should test representative workloads rather than rely on broad product claims.
Evaluation Area
Evaluation Area | Databricks | Microsoft Fabric | Snowflake |
Common strengths | Data engineering, lakehouse workloads, data science, machine learning and AI workflows | Integrated analytics experience across data engineering, data warehousing, BI and related workloads | Managed cloud data platform with strong SQL analytics and data sharing capabilities |
Consider when | Engineering, data science or AI workloads need a flexible platform and shared data foundation | The organization values an integrated Microsoft analytics experience and Power BI alignment | The organization prioritizes managed SQL analytics, governed data sharing and cloud data warehousing |
Assess carefully | Cluster/compute design, workload management, skills, governance and operating costs | Capacity planning, workload behavior, licensing, governance and integration boundaries | Compute sizing, storage and transfer patterns, workload concurrency and cost controls |
These are high-level decision prompts, not a complete feature comparison. Product capabilities and licensing change over time. Validate current documentation, pricing, regional availability, security requirements, and workload fit during a proof of concept.
- Faster reporting and analytics cycles
- Reduced infrastructure costs
- Improved data accuracy and governance
- Enhanced decision-making through real-time insights
For example, healthcare organizations have achieved:
- 40 percent faster reporting
- 25 percent reduction in data inconsistencies
- Significant cost savings by modernizing legacy systems
How Niracore Can Help
Niracore supports organizations working to turn fragmented data into reliable analytics and operational insight. Depending on the engagement, support may include data engineering, analytics architecture, dashboard development, cloud integration, and implementation planning.
For a Databricks initiative, a practical starting point is to define the business objective, review the current data environment, identify the most valuable use case, and establish a realistic delivery roadmap. This helps teams focus on measurable outcomes before committing to a large-scale transformation.
If you are evaluating a lakehouse, modernizing data pipelines, or preparing governed data for analytics and AI, explore Niracore’s Databricks consulting services to discuss your requirements.
A trusted partner like niracore ensures:
- Seamless integration with existing systems
- Custom workflows aligned to business goals
- Scalable architecture for future growth
- Advanced analytics and AI model development
- Ongoing monitoring and optimization
This approach ensures that your investment in Databricks delivers long-term value, not just short-term results.
Building a Data-Driven Future with Databricks
The future belongs to organizations that can harness data intelligently and act on it instantly.
Databricks is enabling this shift by combining data engineering, analytics, and AI into a single, powerful platform. From improving patient outcomes to optimizing global supply chains, its impact spans every major industry.
Databricks Across Industries: A Modern Guide to Data-Driven Transformation is not just a concept. It is a roadmap for businesses ready to lead in a data-first world.
With the right strategy and the right partner like niracore, organizations can move beyond data management and step into true data-driven transformation.
📩 Email: sales@niracore.com